

Get full control over your infrastructure and save up to 75% on cloud bills with Uniskai!
Try For FreeEstimate to succeed in Cloud: understanding DevOps metrics
Adopting new digital workloads on cloud platforms intensively, DevOps teams are responsible not only for the development but also for how this software gets into production and how it is supported. Yes, you build it – you run it! But the question is: how can you be 100% sure that your software development life cycle is on the right track? Understanding basic DevOps metrics prevents you from collecting the wrong data that might significantly slow down your business development.
Why DevOps metrics matter
DevOps metrics are the tools to measure the performance of a DevOps software development pipeline and help identify and remove any bottlenecks quickly. Metrics are important for any business because they track the achieving high-level goals, including quality, velocity, stability, and release readiness.
Here is a short list of the metrics tracking benefits:
- Decision making. DevOps metrics provide transparency and form the basis of the informed decisions that drive positive change.
- Security. While some issues may be noticed after the deployment, the DevOps metrics identify defects that escape production.
- Cost saving. Automated measurement removes subjectivity and overhead expenses.
- Delivering value. Metrics show what kind of value is delivered to the customer and what performance level is needed to reach the desired business goals.
- Virtuous cycle. People responsible for a certain metric adjust their efficiency to improve the metric on their end.
Google’s DevOps Research and Assessment (DORA) team has been analyzing the state of DevOps across organizations and determined four key metrics to measure DevOps success.
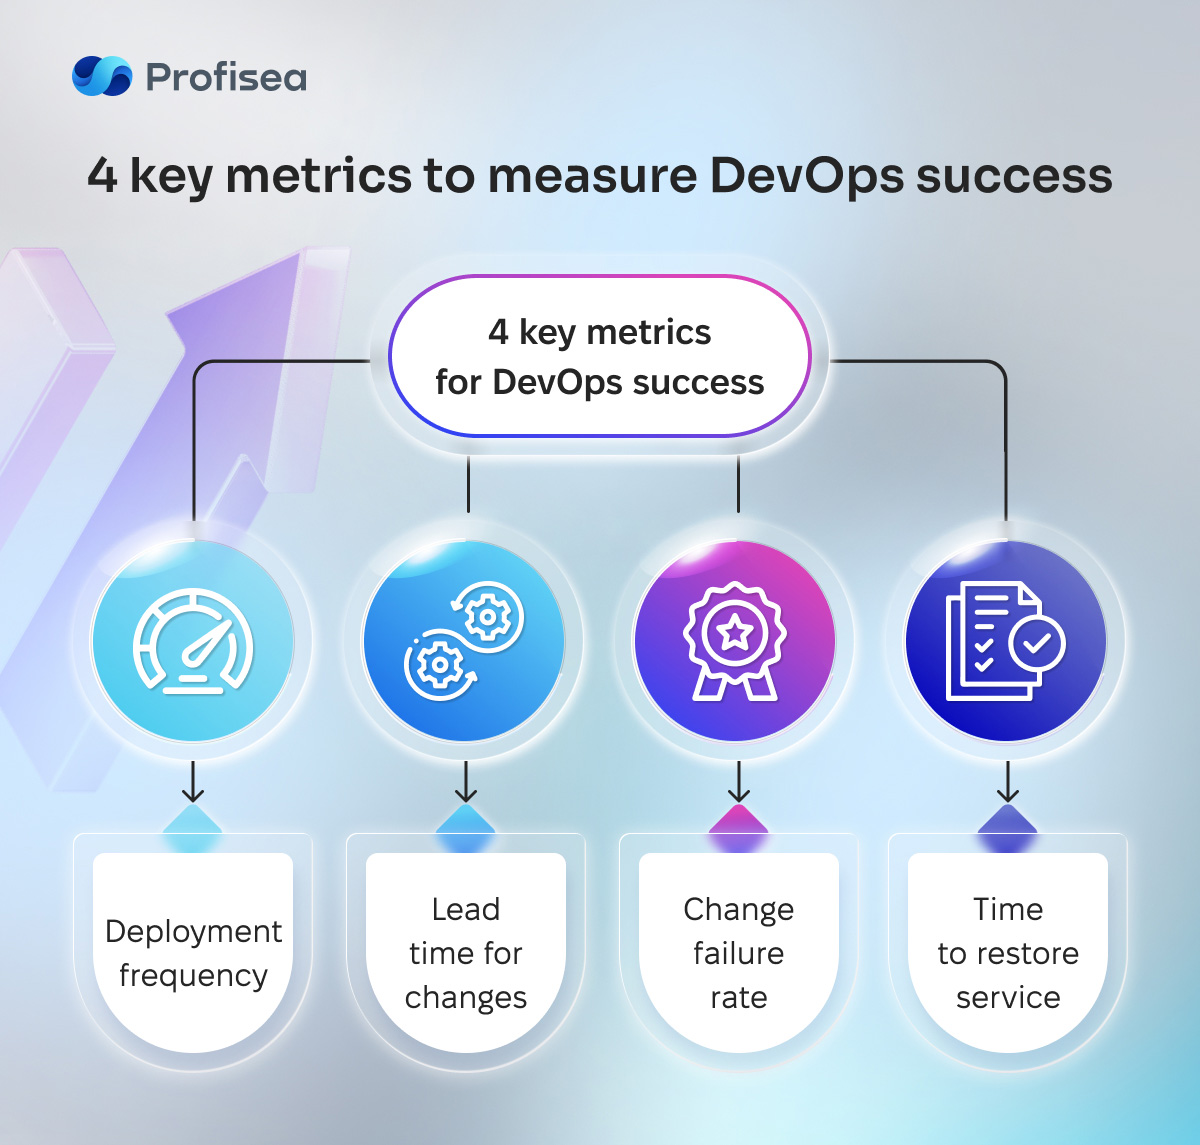
Regularly implementing these metrics, you get a clear understanding of the DevOps level – High, Medium, or Low – at your company and monitor its progress. Let’s take a closer look at them.
Deployment frequency (DF)
Deployment frequency measures the correspondence of successful application releases to production. In other words, it tracks how often you deploy code for a particular software.
In the ideal world, being so confident with automated tests, you can release a build every day. But there are situations when the team has to follow a company’s rule to release once a sprint or to have two days of manual testing.
By and large, one deployment per week is a good practice. But high-performing companies, depending on the product, release on-demand or even make up to seven deployments a day.
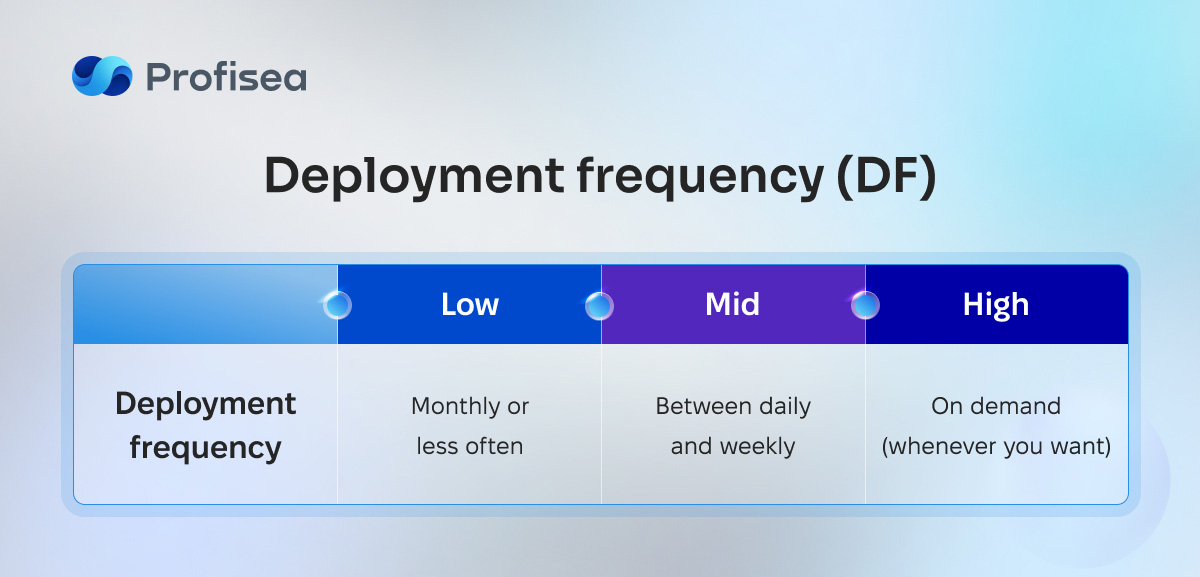
The DF metric shows that your company is more successful if it does more frequent but smaller code releases to end-users.
Lead time for changes (LT)
The LT metric estimates the time that your code takes from commit to production. Two indicators are required to measure deployment velocity:
- the exact time of the commit
- the exact time of the deployment.
The lower the lead time for changes is – the better your results are.
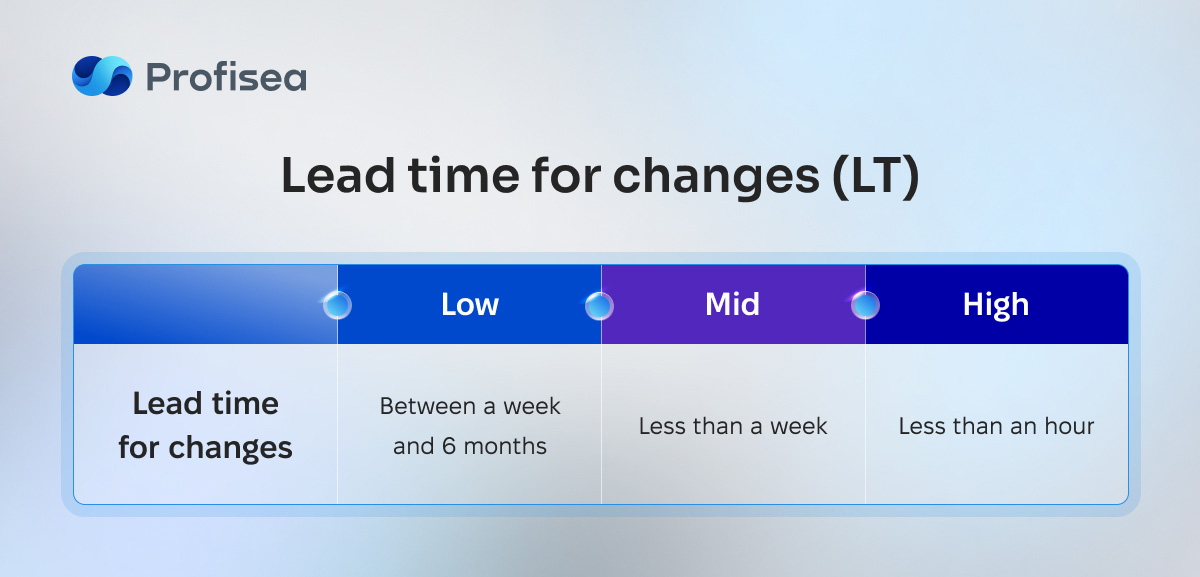
With the LT metric, you get a clear understanding of the DevOps team’s efficiency and find out how growth in requests is operated.
Change failure rate (CFR)
No matter how hard you try, errors occur after releases. The CFR metric provides insight into how much time was spent on bug fixing compared to delivering new code.
CFR calculates the percentage of changes to a code after rollbacks or production failures. Low and medium performers fall somewhere between 16% and 30% but needless to say, you should strive for excellence.
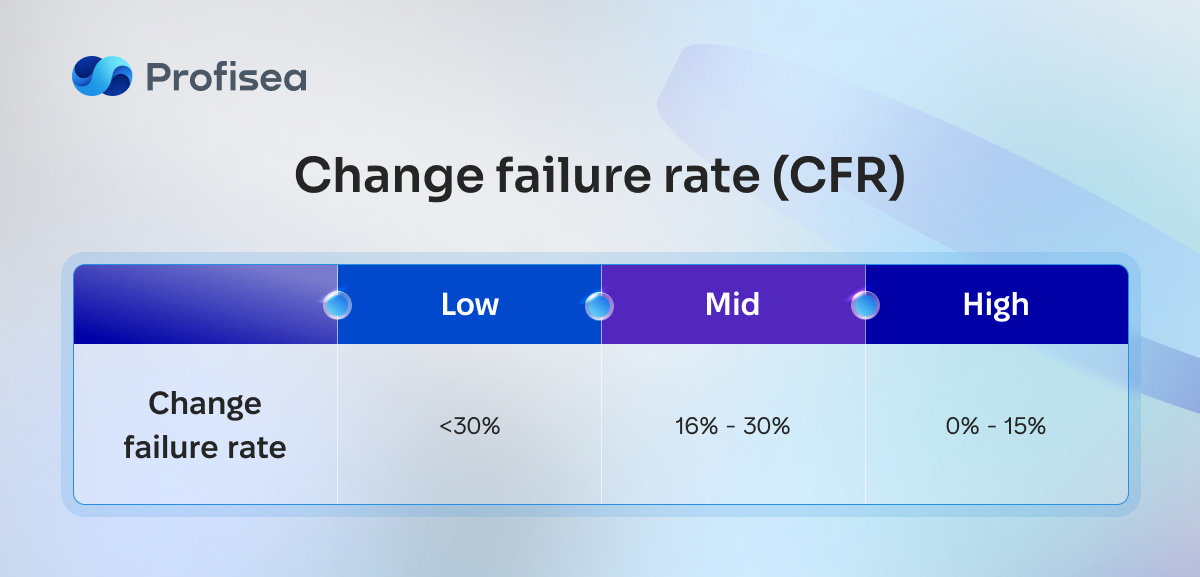
While DF and LTC metrics indicate the tempo of software delivery, CFR represents the quality and stability of your application.
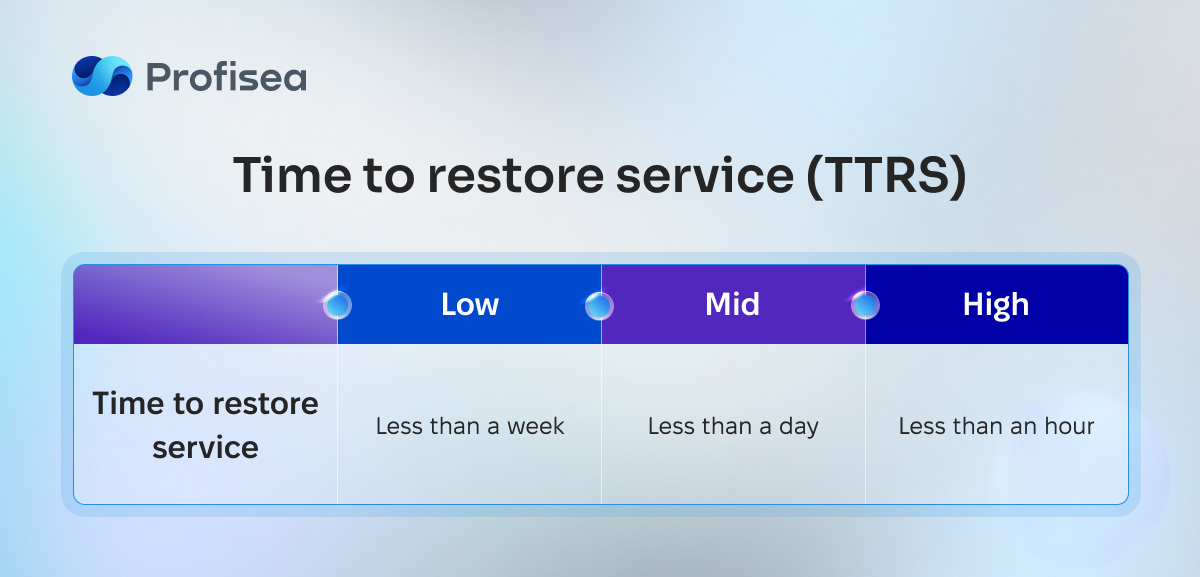
Time to restore service (TTRS)
No matter how high-performing your DevOps team is, unplanned outages or failures happen. Short recovery time makes a big difference as it creates a competitive advantage and improves business revenue.
The TTRS metric measures the time a service needs to restore or recover a system or application from a failure. It is estimated by the standard time between a bug report and the timestamp at which the patch is deployed.
Deployment frequency, lead time for changes, change failure rate, and time to restore service are the most important DevOps metrics. Together, they provide the basis to identify any waste in your DevOps processes and improve the product value stream.
Profisea: implement DevOps metrics successfully
It’s critical to carefully consider the DevOps metrics you need to monitor and keep in mind that no one solution works for all situations.
Since 2015, Profisea has been providing a full spectrum of Cloud Management services. Our goal is to select the metrics that provide the most relevant information for your company.
Profisea`s top DevOps experts have the necessary expertise to analyze your pain points and help businesses of all sizes – SMBs, SMEs, or large enterprises, transform organizational mindsets, increase productivity, and boost performance.
It’s always a good idea to start your cloud transformation with Profisea! Just enter your details – and we’ll reply within 24 hours.