
Get full control over your infrastructure and save up to 75% on cloud bills with Uniskai!
Try For FreeCloud visualization. Have your cloud under the watchful eye!
Cloud hosting is the trend every organization is willing to adopt. Progressive businesses give up building in-house computing infrastructures for cloud hosting services and solutions administered by giant world’s cloud providers like AWS, Azure, or Google Cloud. According to a PwC report, 75% of IT decision-makers are considering turning to the cloud’s adjustable and scalable services. Taking advantage of IaaS also gives you the flexibility to innovate faster, duplicate production environments, scale up or down ad-lib and take advantage of new technologies as they are released. However, with great flexibility also comes a new set of challenges like the complexity of managing and security. So, understanding the infrastructure’s current state, automated planning of the future steps, lightning-fast troubleshooting, easily triggered scaling-up/down, and supervised security can be carried out with the help of cloud visualization. State DevOps Report indicates that high-performing IT organizations experiencing 60X fewer failures and deploying 30X more frequently identify visualization as an effective way to build quality into the system.
“Operational visibility with real-time insight enables us to deeply understand our operational systems, make product and service improvements, and find and fix problems quickly so that we can continue to innovate rapidly and delight our customers at every interaction. We are building a new set of tools and systems for operational visibility at Netflix with powerful insight capabilities,” says Justin Becker, Director of Engineering at Netflix, that utilizes visualization tools like clockwork and publicly reveals insights into their operations because it attracts engineering and operations talent.
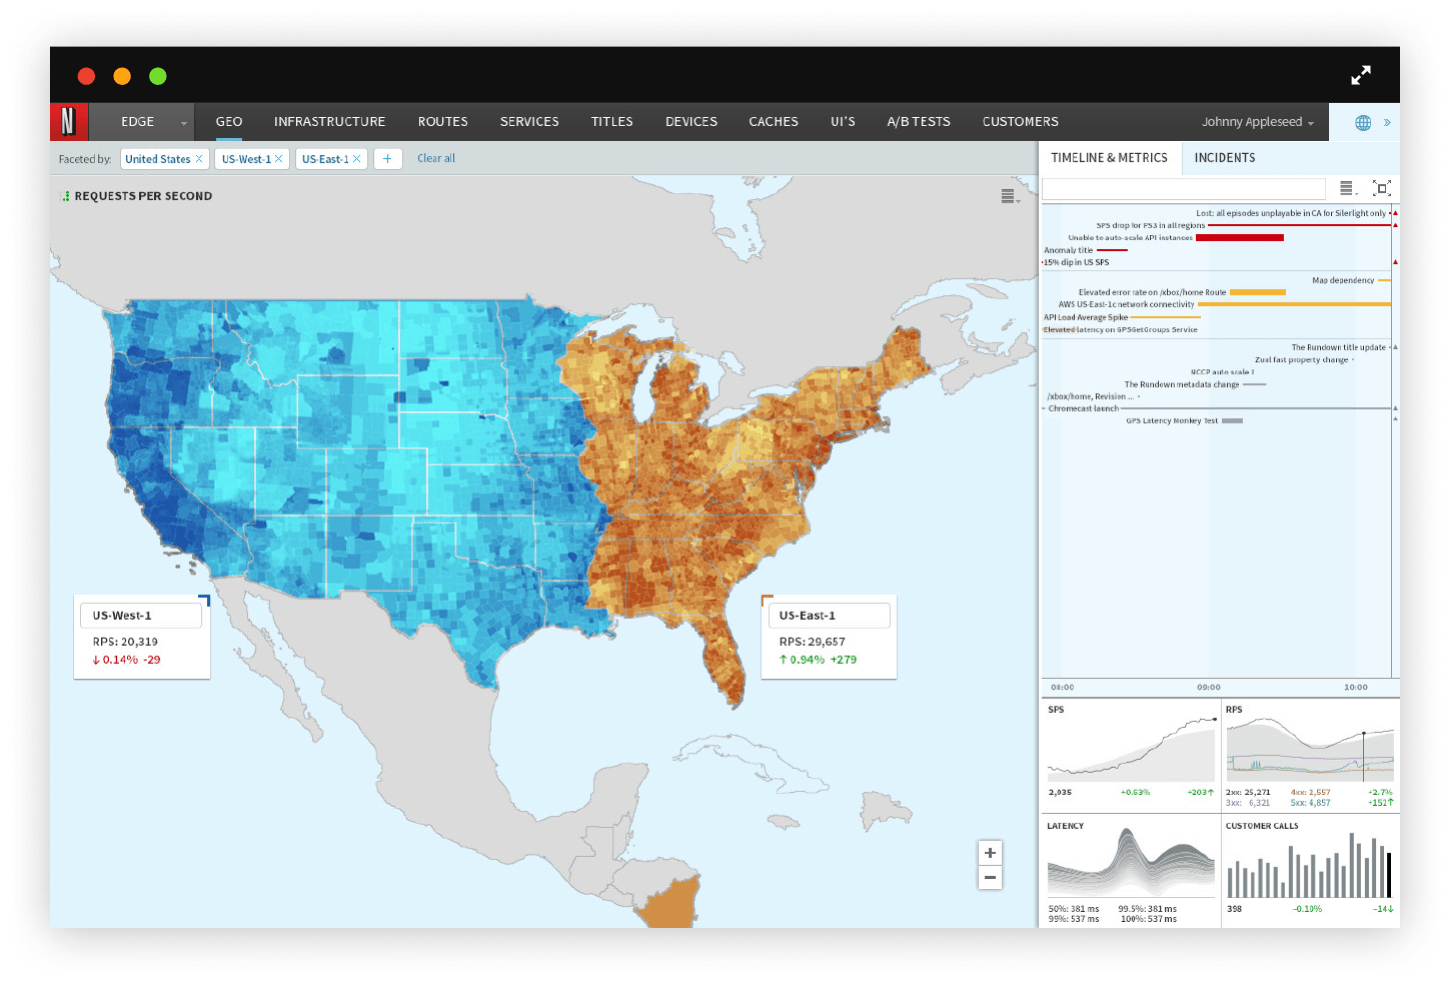
Source: netflixtechblog.com
However, for cloud visualization to work it should be implemented properly with the right data visualization tool. And yes, there are lots of them but not all of them are right for you. So, buckle up and fly high to reach out to the clouds to talk about the importance of cloud visualization, cloud visualization tools, and how to choose one.
Visualize your infrastructure, and business growth shall be given to you!
Cloud visualization is a process of creating a visual representation of all your virtual assets, nodes, networks, artifacts, and others. The best thing about this trend is that such a transformation of cloud resources will not be complicated and time-consuming, considering the ability of services cloud providers present (by the latest count, the list of services that AWS offers above 300 services across multiple categories). Nowadays, you have specific digital instruments that help DevOps, security engineers, and analysts generate cloud environment diagrams automatically that previously required hours of work. Plus, you don’t have to be a cloud expert to become a visualization professional and start optimizing your cloud architecture today.
Top 5 best cloud infrastructure visualization benefits
So, what perks do you get from turning to a cloud visualization approach? With could visualization you:
1. Take total control over cloud resources. Сloud infrastructure visualization lets you gain comprehensive knowledge about all virtual resources you have in place. You get a clear view of any misconfigurations, defects in your systems, services/data storage, and other configuration details. Automatically generated real-time maps and diagrams enable higher visibility of rapidly changing cloud environments. Plain and brightly presented infrastructure diagrams and graphs seamlessly communicate the whole picture of your resources network, what’s happening with load balancing and redundancy, which access levels each user has, etc.
2. Develop a more effective cloud cost optimization strategy. Cloud visualization instruments are essential for saving your budget. They streamline your operations and provide all resources observability 24/7, letting you create a bulletproof cloud cost optimization strategy. You can generate reports for and visualize any amount of any-size data in environments, which provides extensive operational visibility with timely insights about the most complex infrastructures.
Design – Create 2D and 3D models, create virtual prototypes
Simulate – Run large-scale simulations and parameter sweeps
Visualize – View simulation results using interactive tools
Collaborate – Securely transmit and share design data and simulation results
Cloud visualization empowers you to understand each element of your systems, processes, and solutions needed to avoid/fix issues quickly. Visualization tools significantly lower your expenses on infrastructure maintenance as they are predictable and easily manageable. Consequently, this paves the way for remarkably efficient cost reduction as you pay as you go.
3. Get DevOps operations agile and streamline. Cloud visualization reduces repetitive, manual work for the DevOps department, enabling faster operations with limitless agility. Your engineers will have more time to focus on high-priority, creative tasks. Visualization of DevOps processes is essential for amplifying feedback loops. Additionally, working with visuals improves communication significantly and boosts teams’ workflows efficiency. With cloud resource visualization tools, any assigned users can access and analyze a real-time visual model of your infrastructure via data-driven interactive maps. You’ll save a substantial amount of expenses by automating unscalable, time-consuming tasks and get extensive flexibility for your enterprise cloud workload.
4. Get improved cloud cybersecurity. Aside from praising public clouds as tools of the future, we can’t avoid the fact that cybersecurity has become a big issue recently. You should always be aware of how data traffic moves through your virtual network and what circulation paths are allowed for it, how your ingress and egress ports and IP addresses work, etc. With cloud visualization solutions in hand, your teams will be able to troubleshoot the infrastructure problems and identify required security configurations faster.
5. Drive system compliance 24/7. By utilizing cloud resource visualization applications, you can continuously track potential compliance violations in a cloud environment and share network compliance details in the form of precise architecture diagrams or graphs. You can also provide these diagrams to auditors to confirm that your system complies with all the industry standards, which is vital when you store sensitive financial/personal data in the cloud.
Yes, I need one or How to choose the BEST cloud visualization tool
Considering the company needs, requirements and goals, you can utilize such cloud visualization tools:
- Open-source apps, when the service code is publicly available;
- Free visualization products, when some limited proprietary cloud visualization tool versions are available
- Proprietary visualization tools, when full paid versions with a wide range of sophisticated functions is available in the cloud or provider’s server architecture.
When deciding on what visualization tool suits your business most, consider these main factors:
- Usability. A user-friendly interface is an equally important factor of visualization solution together with flexibility and analytical functionality.
- Integration ability. When data lack issues take place, a good visualization tool easily connects to external sources and extracts critical information from them.
- Scalability. Consider the tool’s scalability level. Hard-to-scale solutions cannot be in favor, for obvious reasons.
- Team skill level. Do not forget to take into consideration teams’ skills when choosing a cloud visualization tool. Many managers skip this step and make a tactical mistake, as with complex tools in hand, they waste lots of the resources to train teams.
How to choose the right Data Visualization Software
And the sweetest: What are the latest trends in cloud visualization functionality? Alongside data visualization in the form of graphs, diagrams, charts, and infrastructure correlations, role-based access management, email reporting, visual analytics, and in-place filtering functionality, contemporary cloud visualization tools present new competitive features. So, here are the latest trends in data visualization:
- Artificial Intelligence. AI & Machine Learning are integrated into modern cloud visualization solutions to catch and cover data patterns faster.
- Actual management. What if you could rightsize, delete, spot/unspot instances right away inside the infrastructure schemes? It would be great! In all fairness, not so many data visualization tools can boast that feature.
- Storytelling. Visual analytics is not enough right now. Demanding customers want visualization tools to enlist narrative while creating data reports, and modern visualization tools incorporate this feature as well. Gartner experts predict that by 2025, we will get most of our information from data-driven narrative storytelling, and 75% of these stories will be generated by automated systems.
Wrapping things up: Cloud visualization? Yes, please!
With the right cloud visualization tools, you easily validate the implemented CI/CD changes within minutes and you get rid of unconnected/unused machines and instances. What’s more, you schedule hibernation, identify areas for improvements and detect misconfigurations/compliance violations. DevOps engineers instantaneously check all development strategies to see if everything is working as expected and gain instant security alerts. But, most importantly, you optimize your infrastructure at most, significantly reducing cloud spendings.
If you have questions about how to choose the cloud visualization tool suitable for your particular company needs, you can always turn to us. ProfiSea Labs professionals have developed a new generation, cloud visualization platform that you can try for free and see how you can improve your end-to-end production cycle on AWS. Plus, we can consult you on any cloud/DevOps-related issue you have. Don’t wait up, contact us, and get a real-time visual of your cloud!